Particle Console
The Particle Device Console is a powerful web interface designed for managing Particle-powered devices. It provides real-time visibility into device connectivity, cloud events, and system logs. From the console, you can trigger remote functions, deploy firmware updates, configure integrations, and monitor the health of your fleet — all from a single, centralized dashboard.
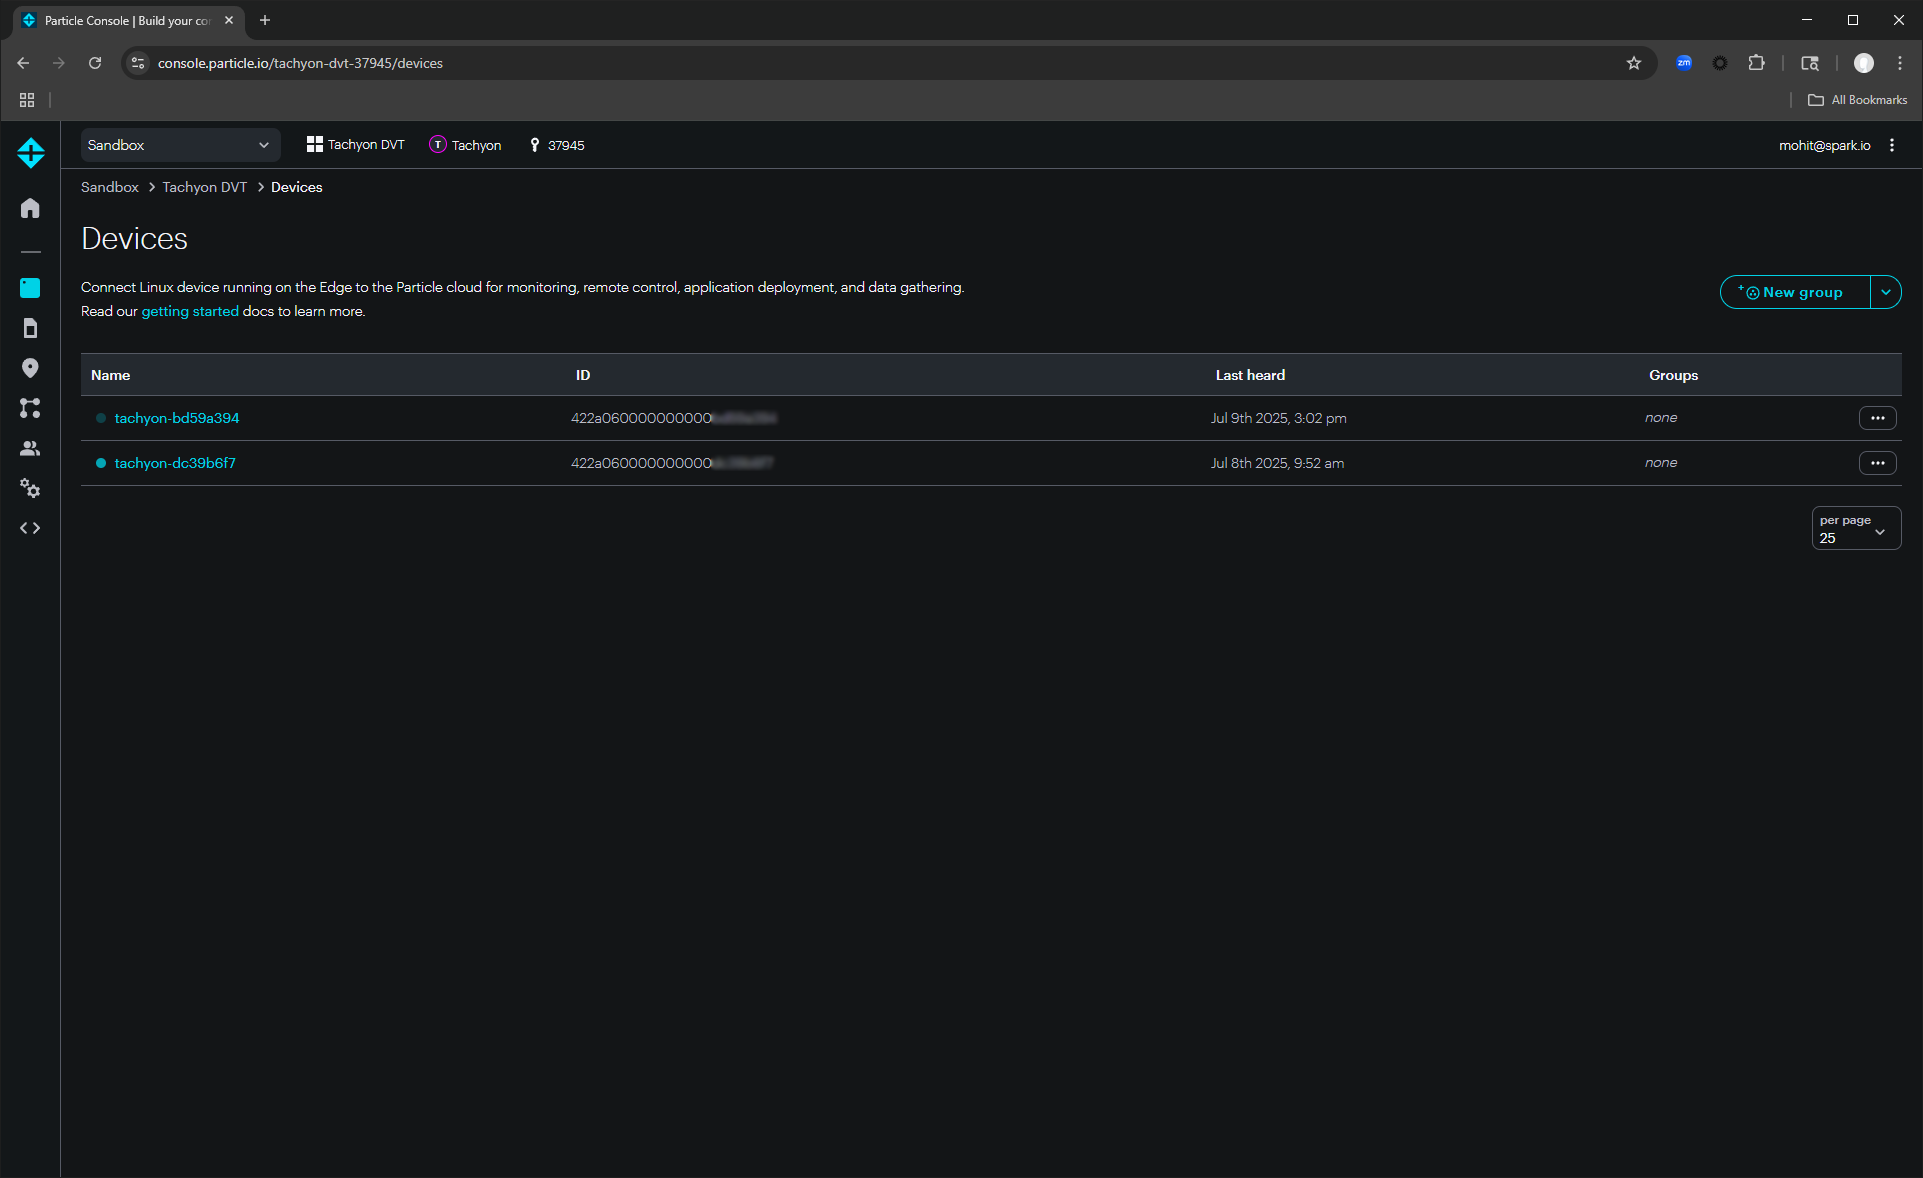
Whether you’ve set up your Tachyon in Headless mode or Desktop mode, you can locate your device in the Particle Console immediately after setup. It will appear under the Product you assigned it to.
After setup, your device may not appear as “connected” immediately in the console. This is expected behavior and the device will show as connected once it establishes communication with the Particle Cloud.
Please read this document on the two types of user accounts inside the Particle device before getting going!
What Happens in the Background:
- The Particle Cloud registers the device but marks it as offline until it establishes a connection.
- The device finishes booting and starts connecting to the cloud.
- The Particle Console auto-refreshes and updates when the device comes online.
You can access your registered device directly using the URL provided at the end of the setup process:
https://console.particle.io/devices/<device id>
Closer Look at the Particle Console
Let’s explore the Particle Console and walk through its key sections so you can navigate it with confidence.
Once you click on a device under your product, you’ll land on the Devices page. Here, you can monitor and interact with your device in several ways:
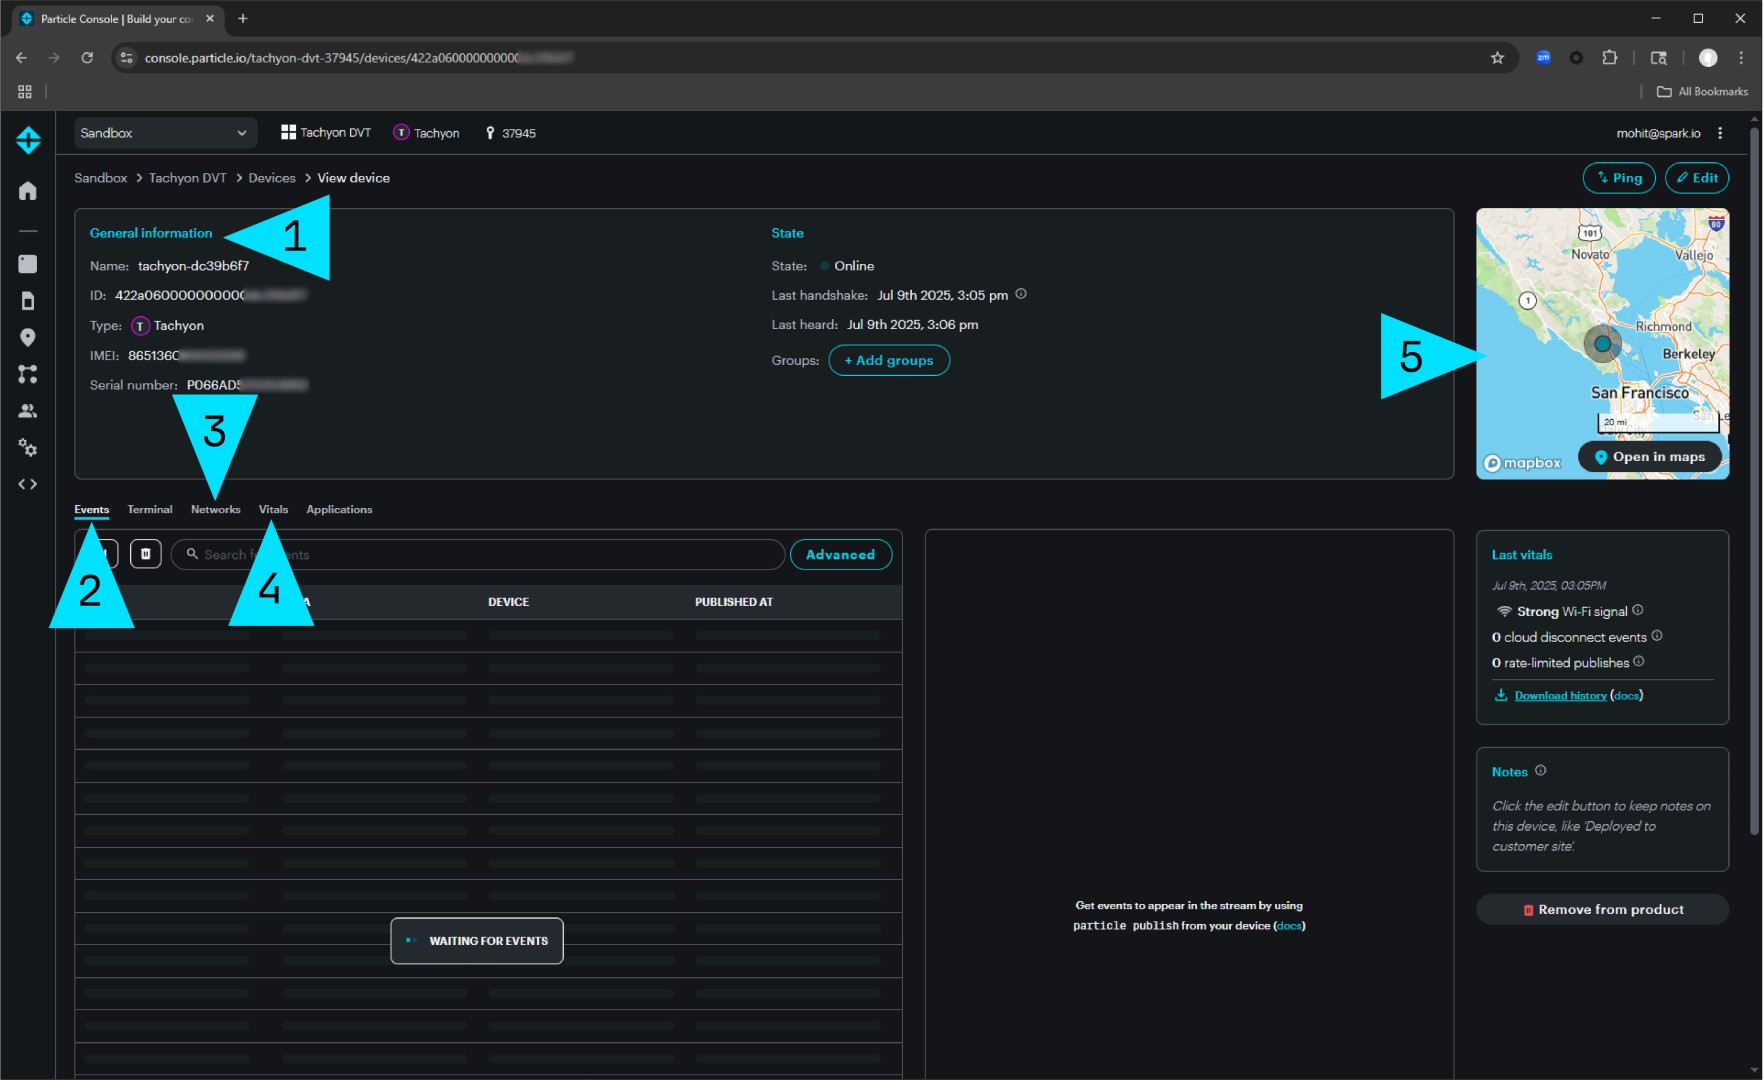
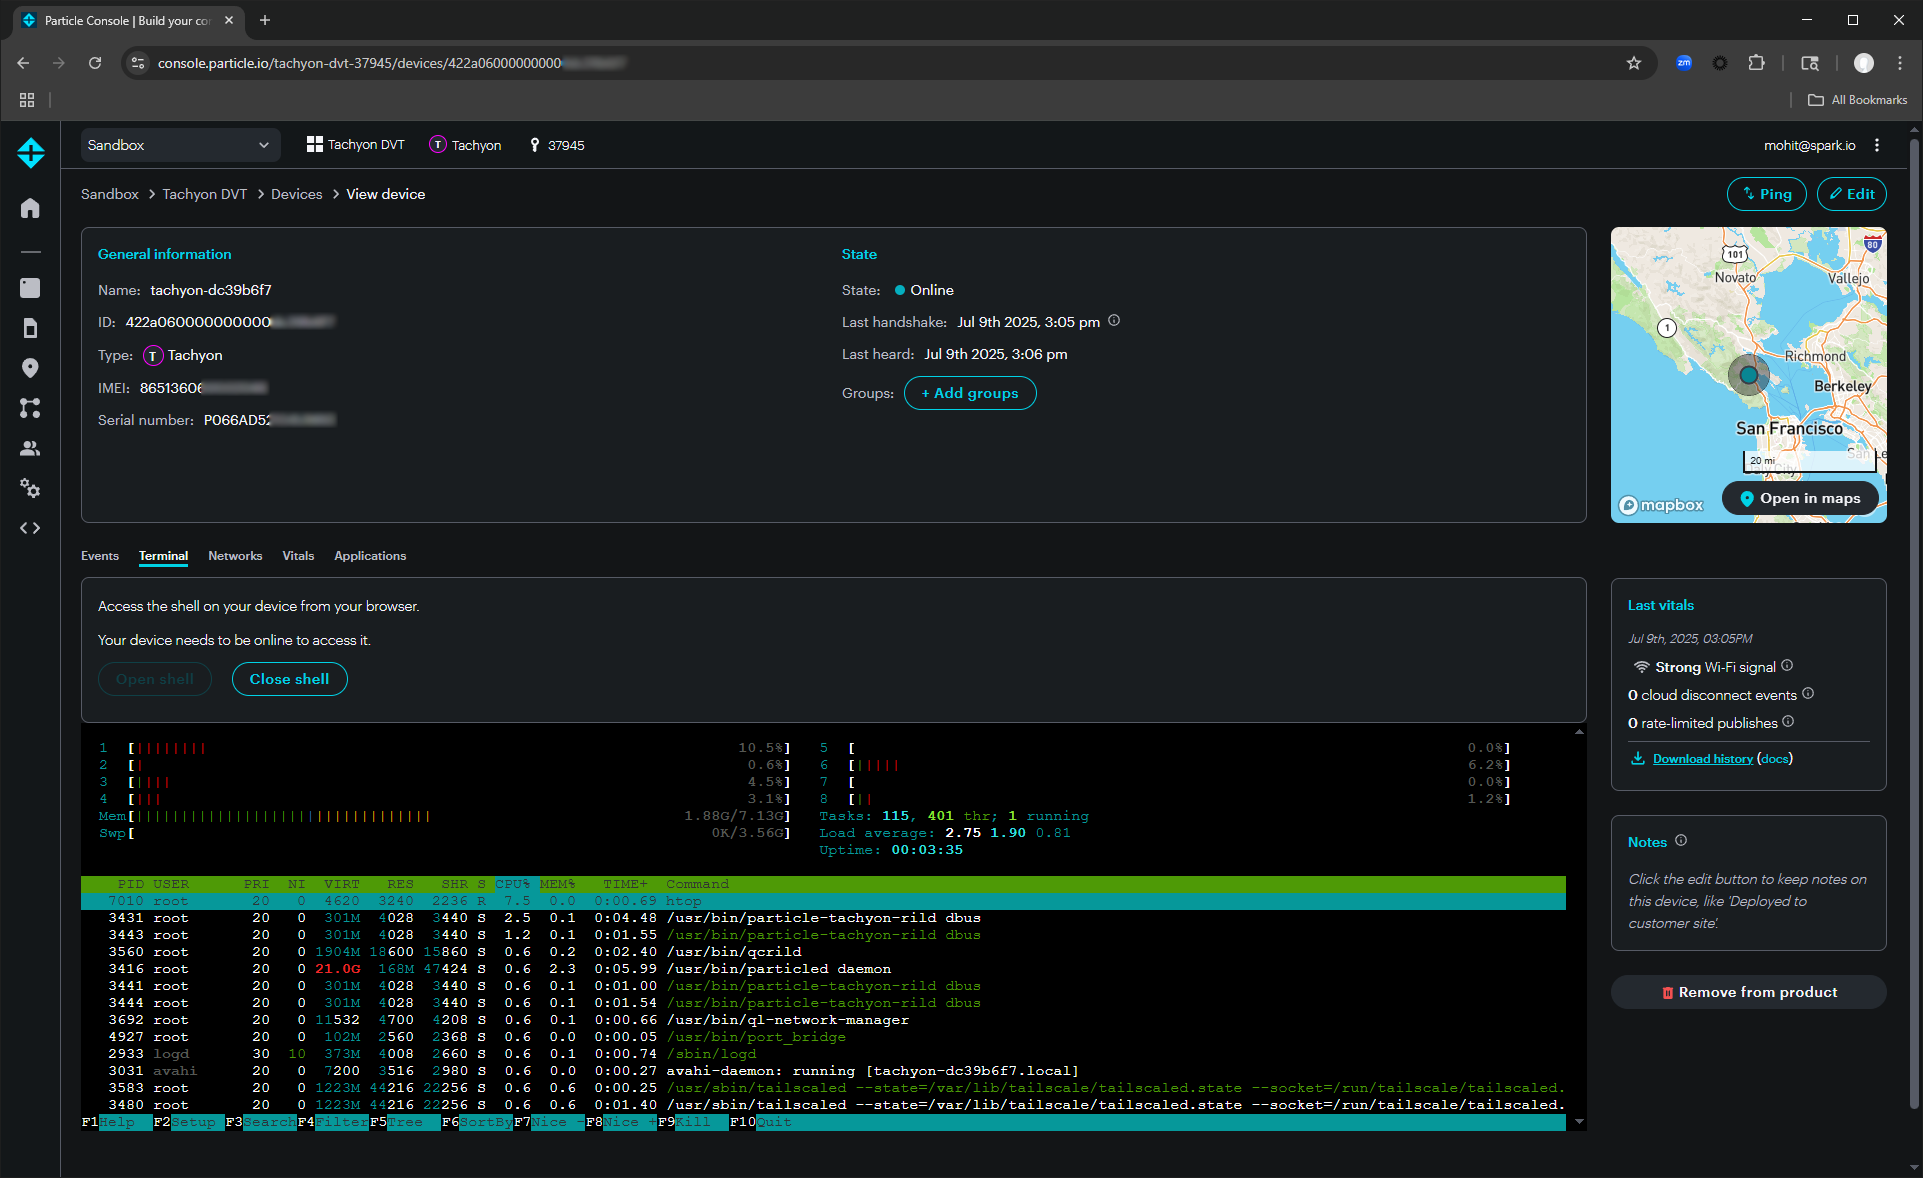
1. Device Information
This section provides essential device details such as the device name, ID, serial number, IMEI, online status, and handshake history. You can also create device groups within a product and assign your device to a specific group.
2. Event Logs
On the left side of the page, you’ll find a real-time event log showing all events passing through the Particle Cloud. Each event displays its name, data, timestamp, and the associated device.
Tip: Clicking on an event expands it to show its detailed data.
3. Network Status
This section shows how your device is connected — via Ethernet, Wi-Fi, or Cellular — along with detailed information like Wi-Fi SSID, Cellular Carrier, and Access Technology.
4. Device Vitals
The Vitals Dashboard displays key metrics that help diagnose connectivity or performance issues. It visualizes data such as:
- Signal Strength
- Signal Quality
- Round-trip Time
- Memory Usage
- Battery Charge
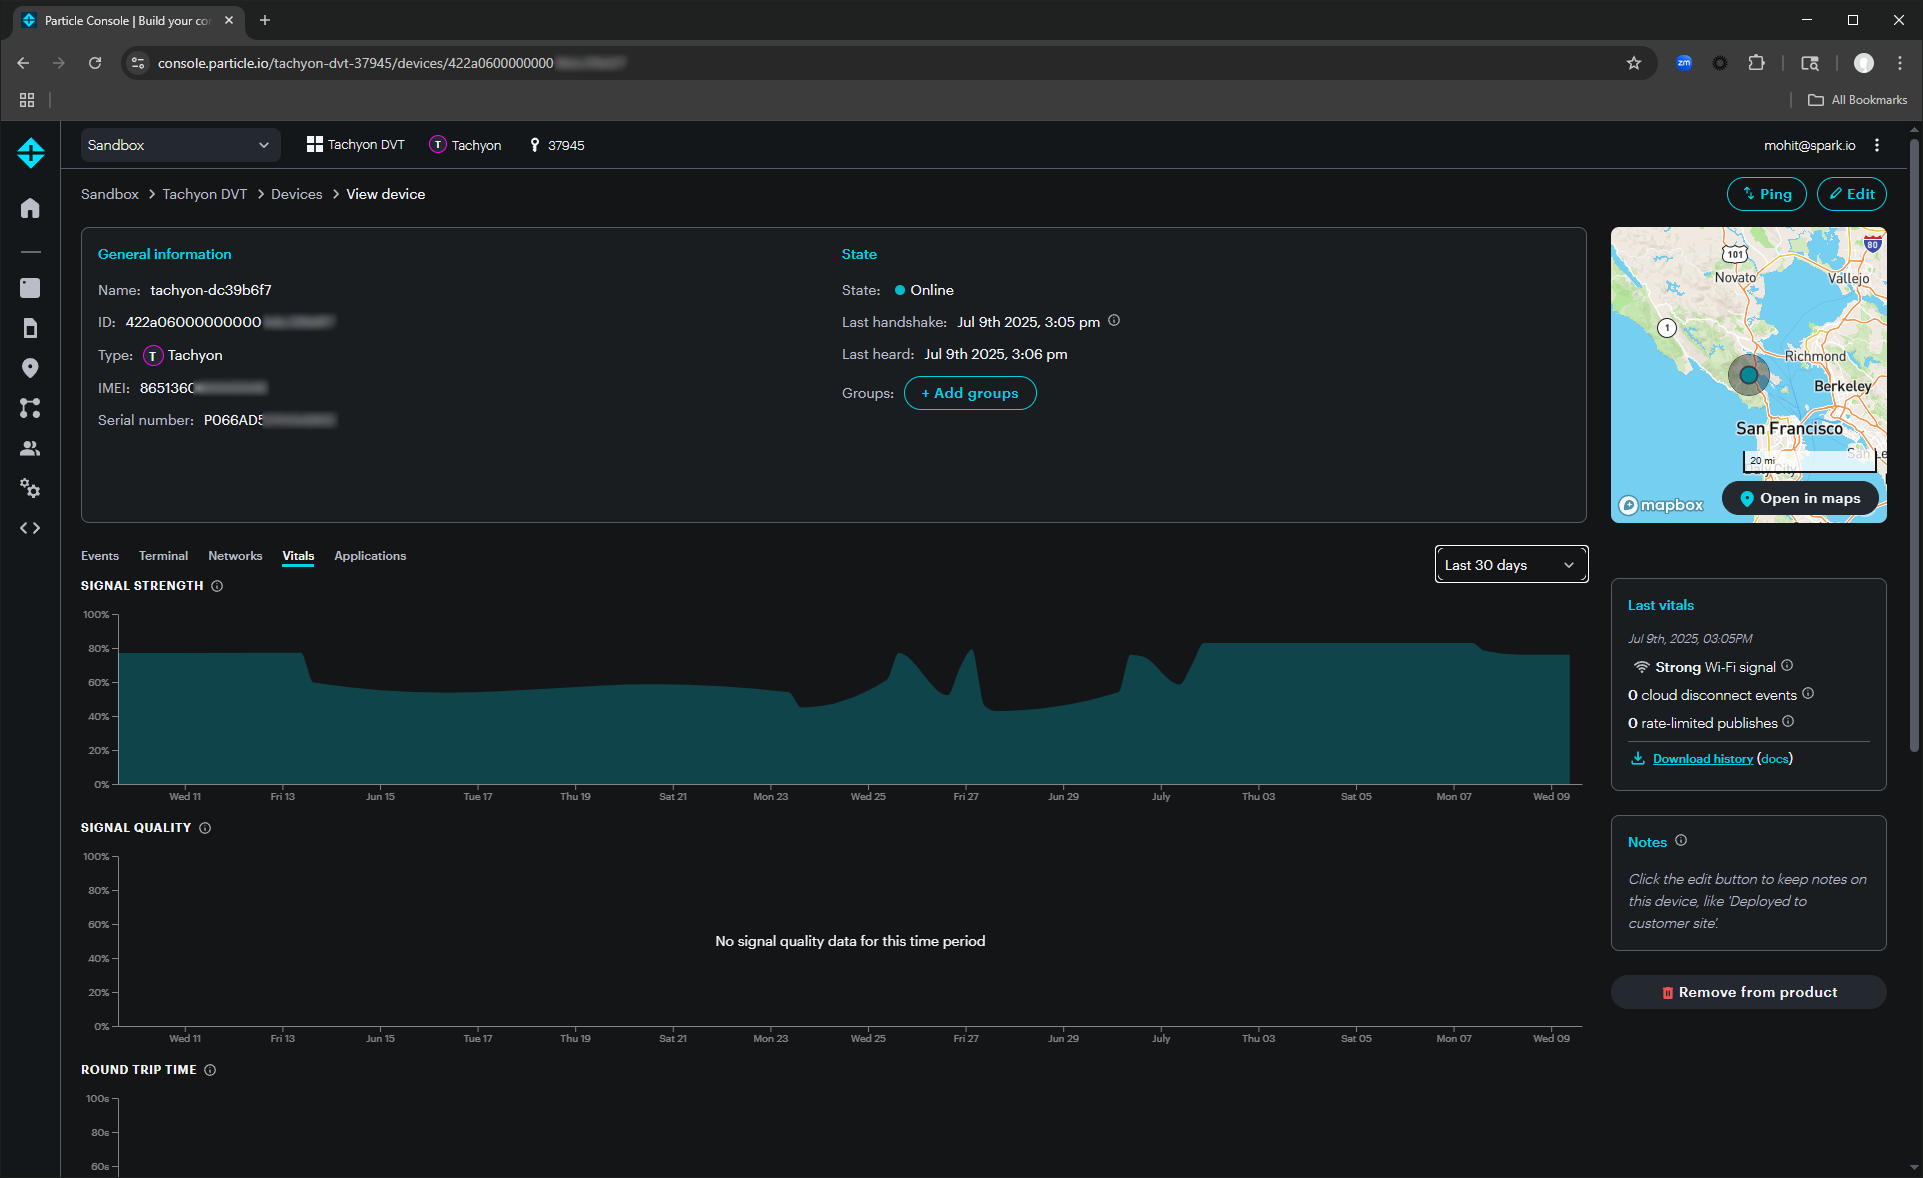
The Vitals Dashboard for Tachyon is still a work in progress!
5. Location Tracking
You can view your device’s approximate location based on cell tower data.
Important: Particle does not collect GNSS (GPS) data for privacy reasons. If needed, you can query your device for its precise GNSS location. See the GNSS section for details.
Remote Access
A standout feature of the Console is the ability to open a remote SSH shell directly to your device (when it’s online). Simply navigate to the Terminal tab, and you’ll be connected.
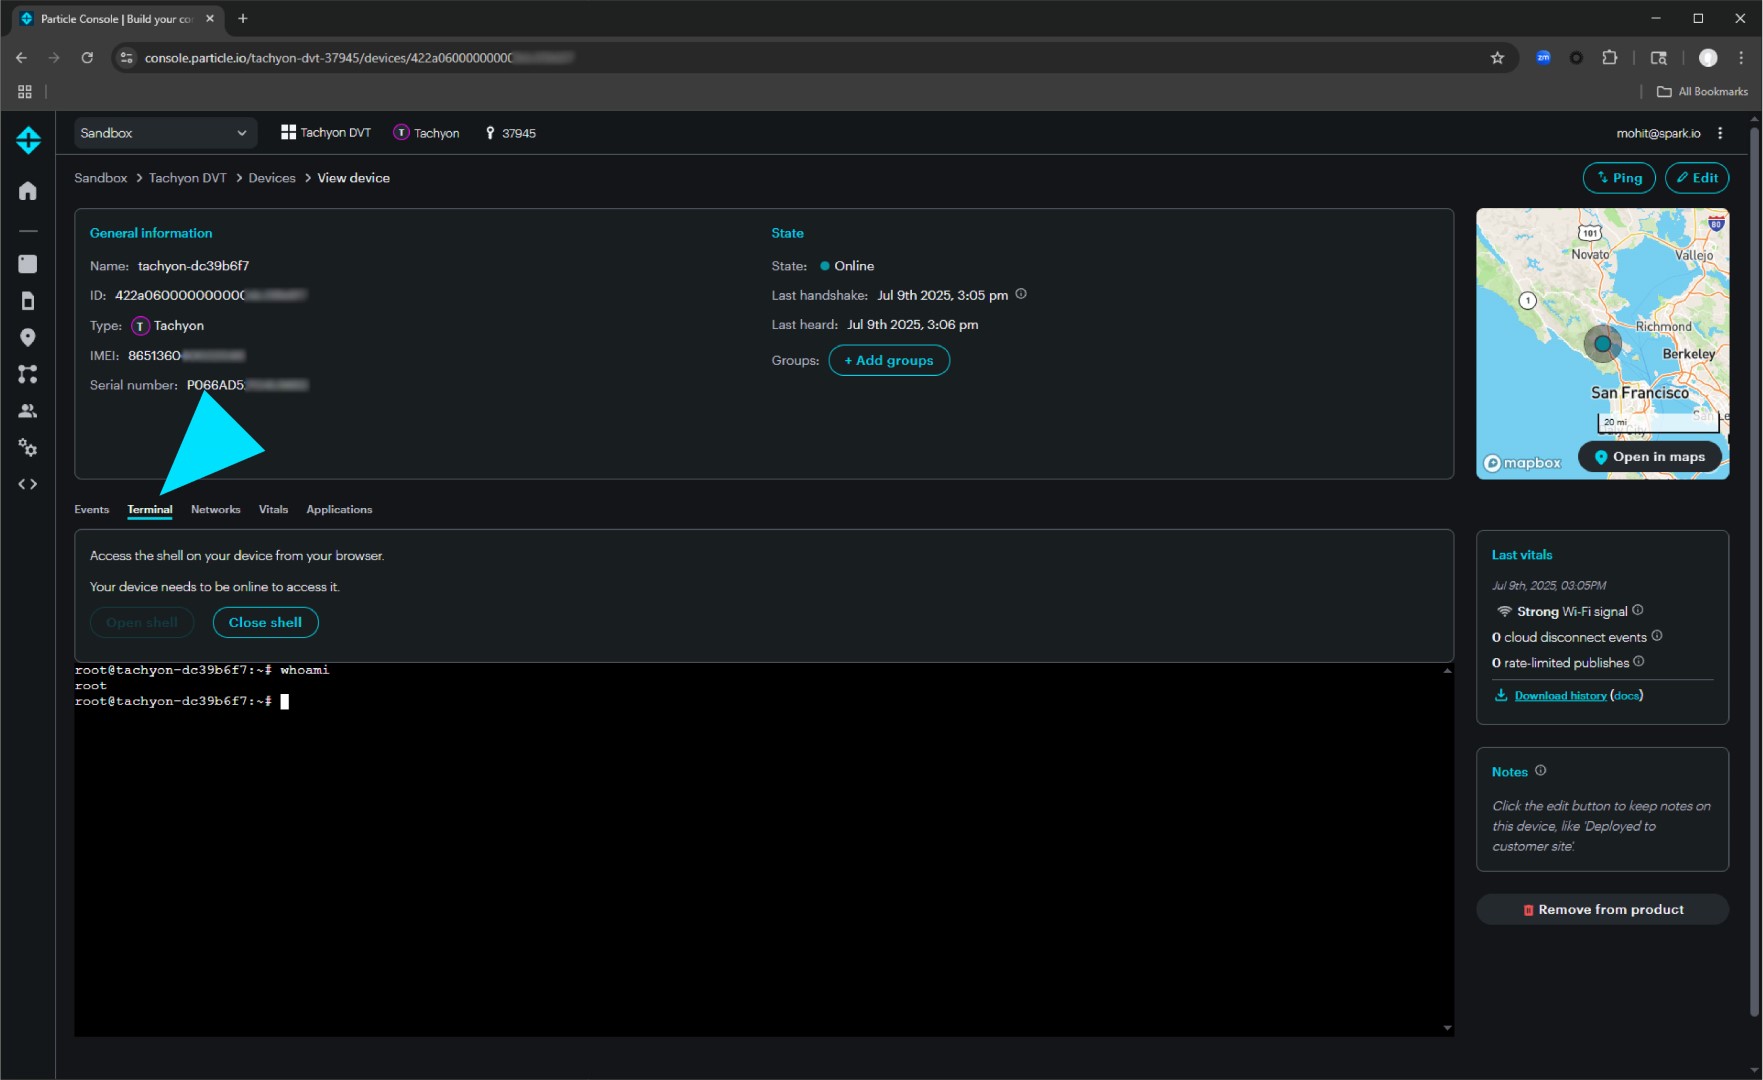
Once connected, you can use this shell just like any other SSH session.
Troubleshooting
If your device is not visible in the Particle Console, here are a few things you can try:
- Refresh the console page.
- Verify that you are signed in with the same Particle account used during device setup.
- Ensure the device has fully booted and the main LED is breathing magenta or cyan.
If you still cannot see your device in the Console, refer to the Troubleshooting section or reach out on the community forums.
Next Steps:
Now that your Tachyon is online and visible in the Particle Console, the next step is to further explore the Particle Cloud — where you’ll learn how to deploy applications to your device and manage an entire fleet.